Year Level Comparison
Objective: Gain an understanding of the Year Level Comparison report
The Year Level Comparison report directly compares the year by year treatment breakdown costs, maintenance costs, operational costs and user costs against the average Service Level criteria states for each selected Simulation.
Once the Workspace is loaded, users can click on the 'Advanced Comparison' tab to view the Advanced Reports.
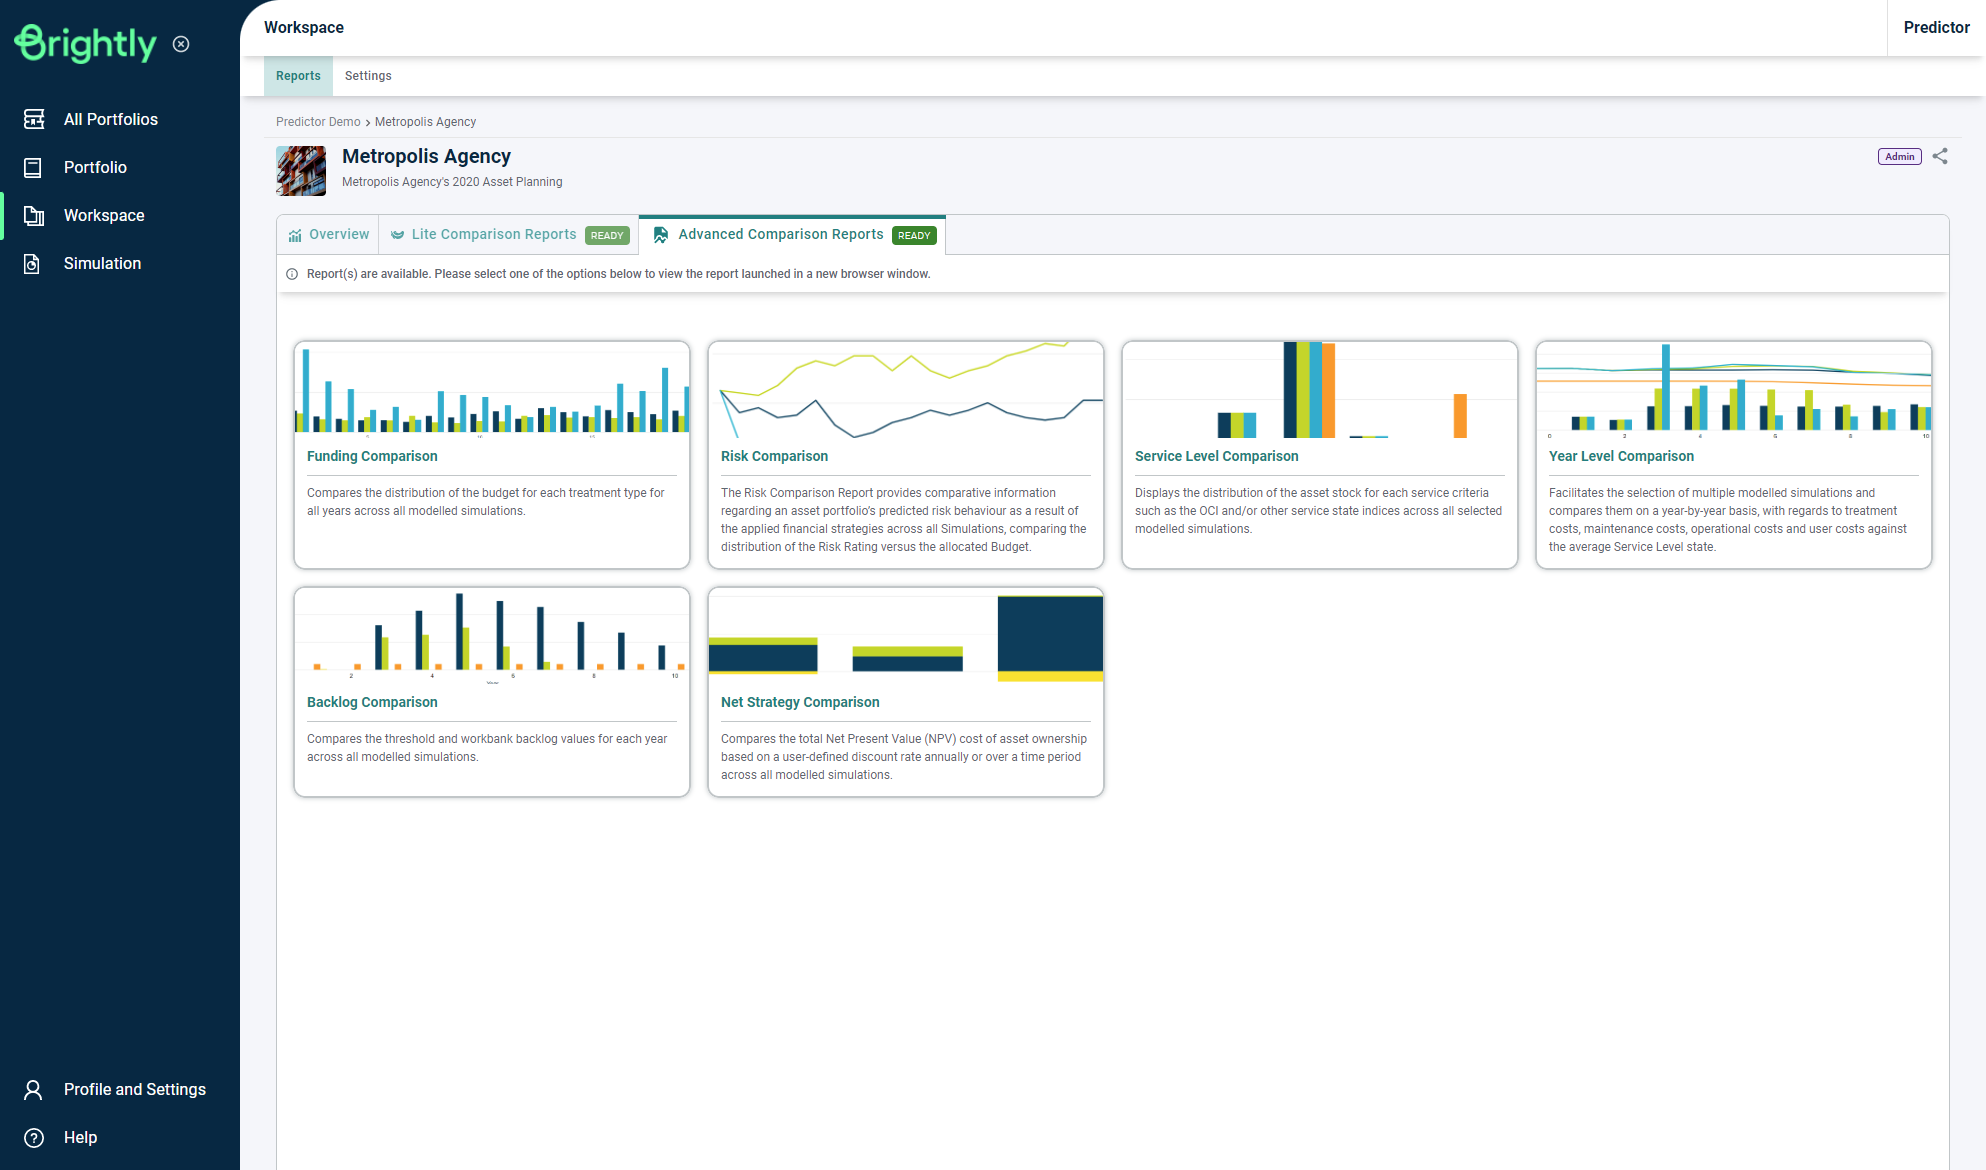
Users can then click the 'Year Level Comparison' button to load the Year Level Comparison report page, where users can view different Service Scaling Methods and Report Types from the options on the left.
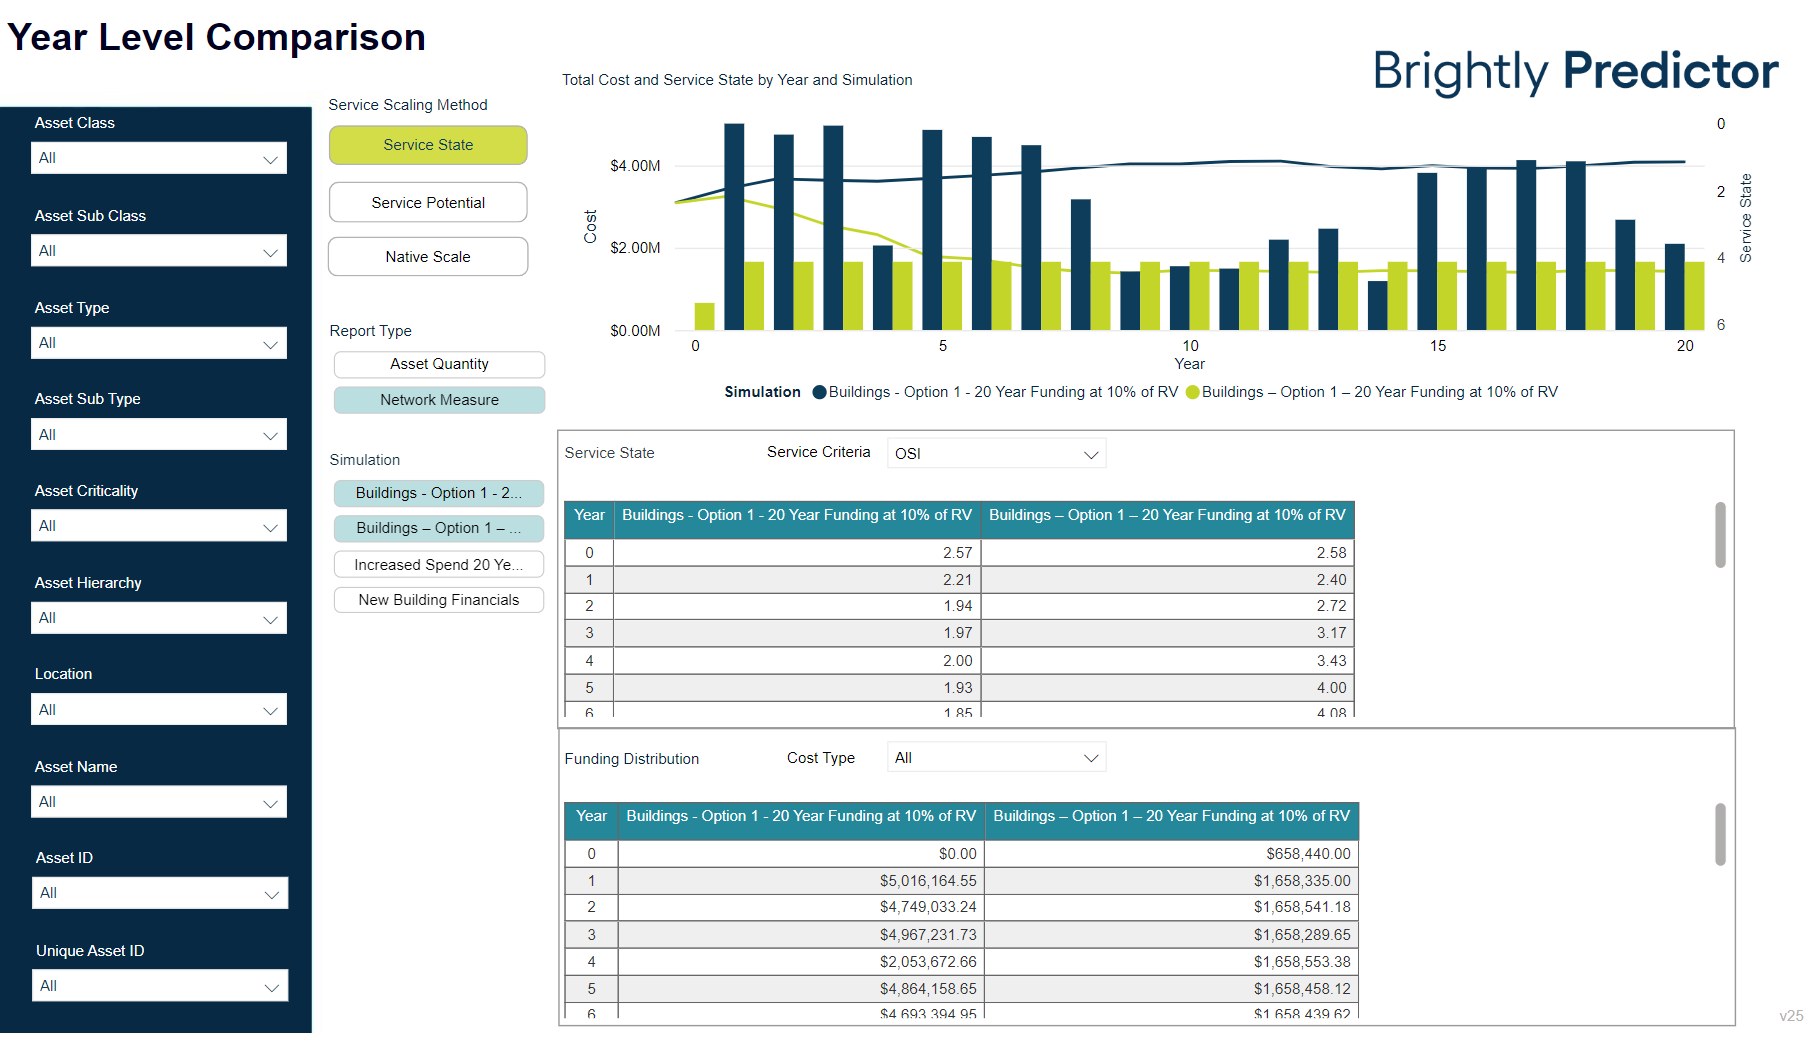
Users will be able to select different Service Criteria and also view different Cost Types for Funding Distribution from their respective drop-downs.
